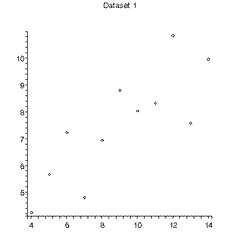
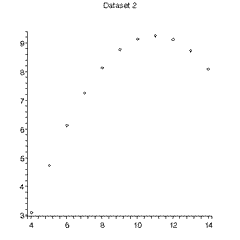
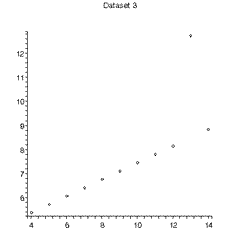
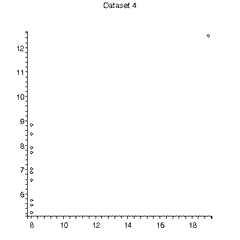
The figures to the right are plots of the 4 datasets of Anscombe.
The plot of Dataset 1 shows that fitting to a straight line is a fairly reasonable thing to do.
The other plots show clearly that these datasets have no relation to a straight-line function.
Dataset 2 is at least a quadratic polynomial.
Datasets 3 and especially 4 show a characteristic of all least-squares fitters: a single "wild" datapoint can seize control of the fit. This is exactly the same problem in comparing the mean and the median of a collection of numbers: the mean is not robust and a single outlier can overwhelm the calculation
 |
 |
 |
 |